2013 Statistical Data
2013 Outpatient Center Statistical Data
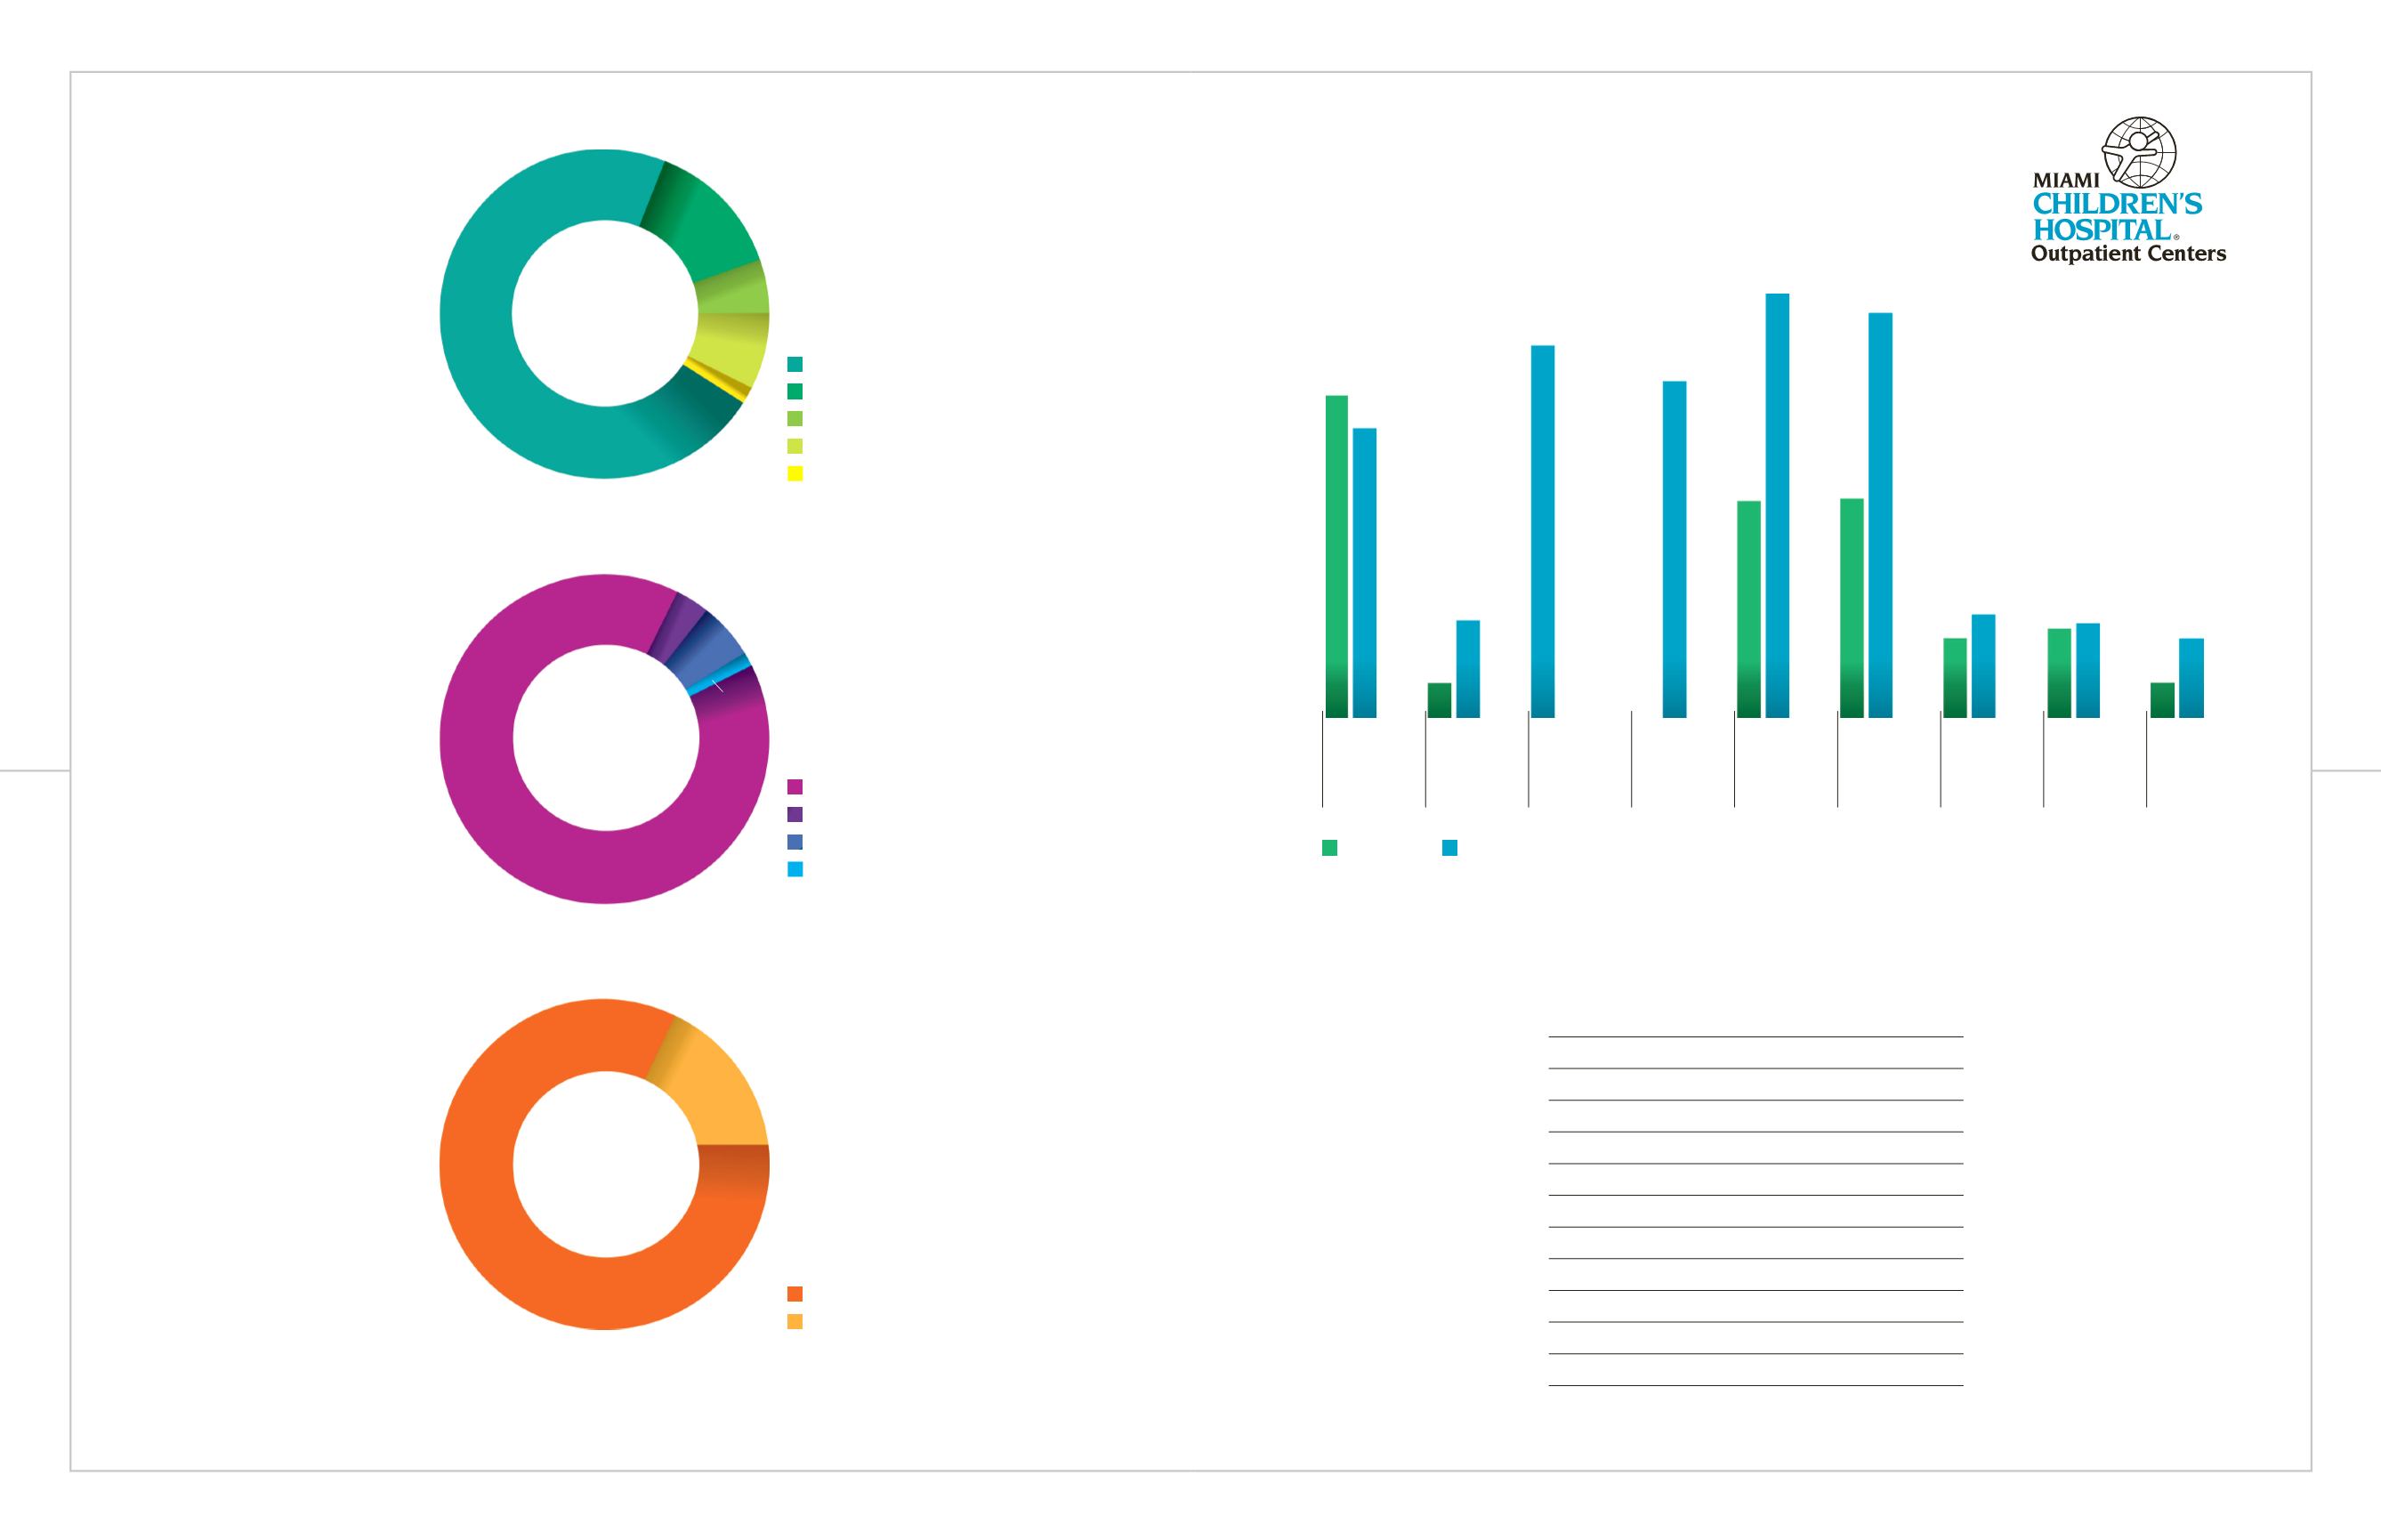
2013 Expenses
2013 Sources
of Revenue
2013 Payor Mix
Salary and Benefits
Supplies
Malpractice and Other Insurance
Depreciation and Amortization
Interest
Net Patient Revenue
Investment Income
Grants and Other Revenue
Net Assets Released from Restrictions
Used for Operations
Medicaid, Self Pay & Other Government
Contracted Managed Care
58.7
%
89.8
%
71.85
%
28.15
%
3.3
%
5.6
%
1.3
%
11.0
%
4.3
%
6.1
%
1.2
%
Total Inpatient Days:
63,140
Total Inpatient Admissions:
11,272
Inpatient Average Daily Census:
173
Inpatient Occupancy:
0.596
Total ER Visits (main campus):
89,907
MCH General Clinic Visits:
12,749
Ambulatory Visits:
61,808
Observation Visits:
4,090
Private Outpatient Visits
(Main Campus):
116,275
Private Outpatient Visits
(Ambulatory Centers):
130,305
Total Surgical Cases:
14,917
Average Length of Stay:
5.6
19,958
17,928
2,171
6,148
16,916
20,838
13,436
13,571
4,941
6,378
5,533
5,837
2,198
4,916
26,281
25,063
0
Urgent Care Visits
Outpatient Visits
2013
Financial &
Statistical
Highlights
Palmetto Bay
Outpatient
Center
DanMarino
Outpatient
Center
Doral
Outpatient
Center
West Kendall
Outpatient
Center
Miramar
Outpatient
Center
Midtown
Outpatient
Center
Nicklaus
Outpatient
Center
Miami Lakes
Outpatient
Center**
Rehabilitation
Services
Miami Lakes*
* Closing Date: September 30, 2013
** Opening Date: October 1, 2013
93
92


